
At the beginning of this year, a new trend broke it big on the Internet: Iceberg charts. Between late 2020 and early 2021, the trend blew up, expanding from a niche Reddit community to YouTube, where YouTubers made their name narrating and talking their viewers through each tier. Often focusing on creepy topics such as conspiracy theories, horror movies, and the weirder sides of the internet, the Iceberg chart has become an all-new way to categorize theories, movies, and other media.
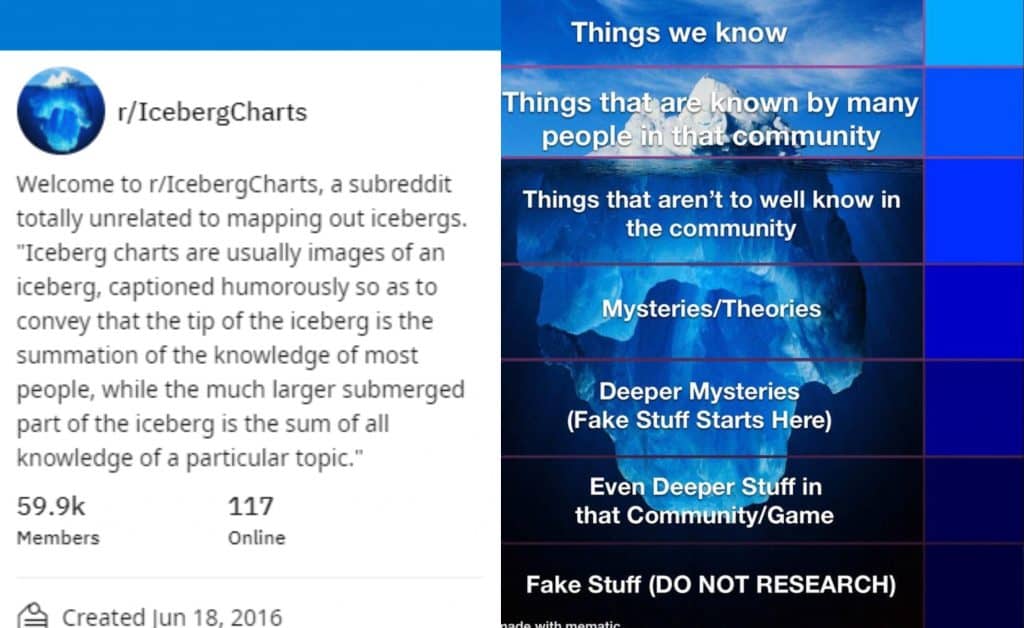
First of all, what exactly is an iceberg chart? According to the subreddit r/IcebergCharts, an iceberg chart is:
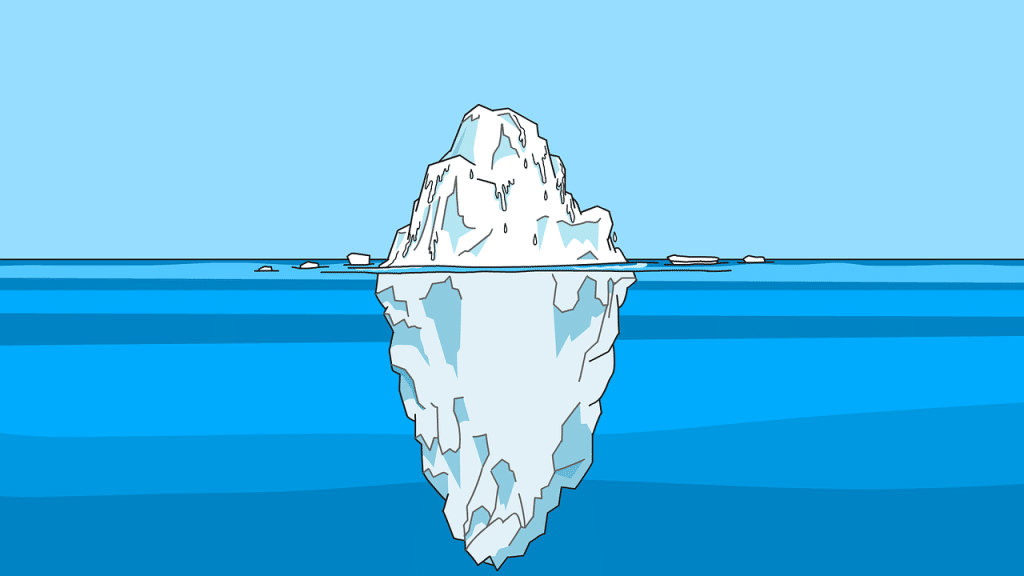
“usually an image of an iceberg, captioned humorously so as to convey that the tip of the iceberg is the summation of the knowledge of most people, while the much larger submerged part of the iceberg is the sum of all knowledge of a particular topic.”
The chart is split into tiers, with the upper tiers covering the most well-known information and the lower tiers containing the more obscure or weirder information. Icebergs can cover anything from conspiracy theories to video game lore. Literally, you can make an iceberg chart on anything, even on iceberg charts themselves!
Credit: -cam-8757- / Reddit
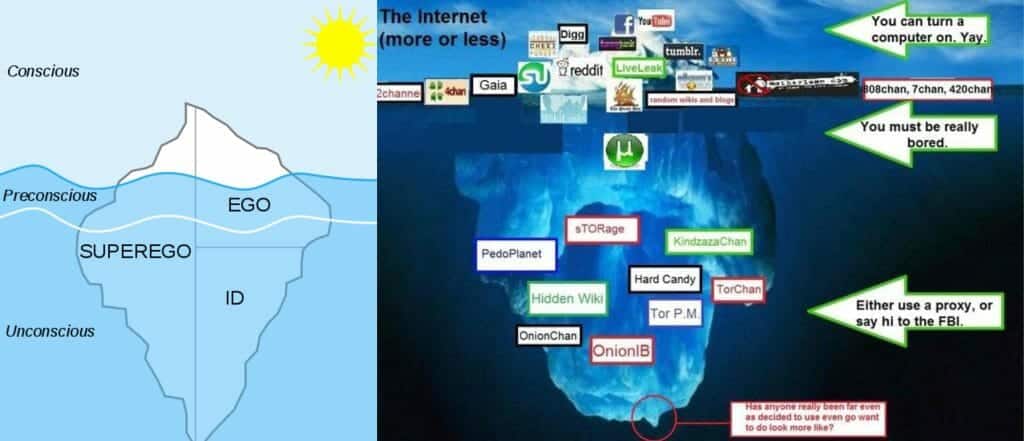
Although the Iceberg meme really became popular in early 2021, the meme has much older and academic origins. The iceberg metaphor has long been used to differentiate between surface and lesser-known knowledge. Renowned psychoanalyst Sigmund Freud used an iceberg metaphor to describe the conscious, preconscious, and unconscious mind. Anthropologist Edward T. Hall created the ‘Cultural Iceberg Model’ as a way to explain cultural differences. The most famous user of the iceberg metaphor was novelist Ernest Hemmingway, whose ‘Theory of Omission’ uses an iceberg to explain what should be obvious and what should be hidden in writing.
The earliest known use of the iceberg chart as a meme is from Imgur in 2011. The iceberg depicted a tier list of websites, ranging from the most used or popular sites at the top and sites only accessible on the deep web at the bottom. The image received over 150,000 views on Imgur, before moving over to the subreddit /r/askreddit.
Credit: historicair / Wikimedia Commons
The original iceberg chart meme gained a following over on Reddit, with many users creating their own charts using the standard iceberg chart template. Redditors went crazy over this new way to categorize information, especially when it allowed people to boast about knowing information or media on the lower tiers. It became a way to assert your depth of knowledge on a certain topic. Anime, videogames, TV shows, and even memes themselves were ranked and sorted onto iceberg tiers. Eventually, a subreddit was created for the icebergs, r/IcebergCharts, in June of 2016.
However, this was still a niche meme, shared on a very small section of the internet. Iceberg charts wouldn’t hit it big until they transferred from Reddit to Youtube in late 2020, all thanks to a small YouTube channel.
How One Man Made The Iceberg Charts Come To The Surface
American YouTuber Isiah Markin (better known as Wendigoon) popularised the Iceberg Chart by creating his ‘Iceberg Explained’ videos, where he talks through each of the tiers and explains the content within each one. His first iceberg chart video was uploaded on November 20th, 2020. What followed was an impressive 20-part breakdown of an immense iceberg chart on conspiracy theories. His channel started to get traction as viewers were hooked on his deep dives into the lesser-known conspiracy theories. His subscriber count inflated rapidly, going from 7000 to 500,000 in a matter of weeks.

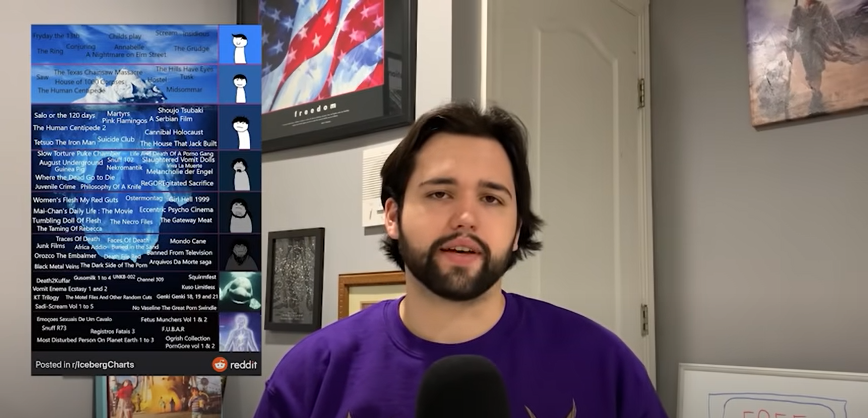
Several other YouTubers followed suit, adapting iceberg charts into video format, popularizing the meme beyond the realms of Reddit. However, the video which truly launched the iceberg trend was Wendigoon’s ‘Disturbing Movie Iceberg Explained’. Posted on June 14th, 2021, the video has close to 5 million views and aided in boosting Wendigoon’s subscriber count and notoriety. He beat the bigger horror, crime, or ‘lost media’ YouTubers to this iceberg (most notably Blameitonjorge, an incredibly popular lost or creepy media Youtuber) and shot the iceberg chart into circulation again.
Wendigoon adapted Reddit user nice-guy-phil’s disturbing movie iceberg into an hour-long video, where he walks viewers through the movies on each tier and gives some background on each one. The movie iceberg goes from surface-level horror movies (such as Friday the 13th and the Saw franchise) to some of the most terrifying horror films to ever exist, which are largely obscure due to the graphic content. Wendigoon bravely traverses through the lower tiers, going where no one else dares to go in terms of horror movies.
After his success, the iceberg trend spread across YouTube, with new channels entirely dedicated to dissecting the charts popping up. Although most icebergs tend to cover darker topics, plenty of users covered charts about video-game lore, anime series, TikTok, and even YouTube videos or channels. Wendigoon continued making his ‘Iceberg Explained’ videos, covering true crime, the SCP foundation, and Star Wars. People appeared to be hooked on these types of videos.
However, all trends eventually fade into obscurity, and the iceberg chart is destined to become just another meme in internet history. Already the iceberg charts are losing traction on YouTube, with ‘iceberg explained’ videos gaining fewer views as the hype around the charts dies down. Despite this, r/IcebergCharts is still active, with new icebergs being posted every day. Even if iceberg charts fall out of fashion for the mainstream audience, the community built on the subreddit will continue to thrive, as users passionately share the depth of their knowledge on their favorite topics using the handy iceberg chart.